You check your portfolio and see it’s up 8% this year. But then the doubt creeps in—is that actually a good portfolio return, or are you underperforming? Without context, that number is almost meaningless.
What “good portfolio return” actually means
A good portfolio return isn’t a fixed number. It depends on what you invested in, how much risk you took, and the time period you’re measuring.
In simple terms, your return is the percentage gain or loss on your investments over time. But calling it “good” only makes sense when you compare it to something relevant.
That’s where benchmarks come in.
A benchmark is a standard you compare your performance against. For example, the S&P 500 average return—often cited at around 7–10% annually over the long term—is a common reference for stock-heavy portfolios.
But not every portfolio should match the S&P 500.
Different asset classes have different expected stock market returns:
Stocks: higher risk, higher potential return (historically ~7–10% annually).
Bonds: lower risk, lower return (typically ~2–5%).
Cash or savings: very low risk, minimal return (often below inflation).
Real estate: moderate risk, returns vary widely by market.
So a good portfolio return is one that matches your risk level and performs well relative to a relevant benchmark.
Why it matters for the average investor
If you don’t know what a good portfolio return looks like, you’re flying blind. You might take on too much risk chasing higher returns—or settle for too little growth without realizing it.
Understanding your returns helps you:
Evaluate whether your strategy is working.
Stay disciplined during market ups and downs.
Avoid emotional decisions based on short-term noise.
Make smarter adjustments over time.
For example, a 5% return might be excellent for a conservative portfolio but disappointing for a stock-heavy one.
This is why average investment return numbers you see online can be misleading. They rarely match your personal situation.
Context is everything.
Common misconceptions investors make
Many beginner investors misunderstand what “good” really means when it comes to returns.
Here are the most common mistakes:
Comparing to the wrong benchmark. A mixed portfolio shouldn’t be compared directly to a 100% stock index like the S&P 500.
Ignoring risk. Higher returns usually come with higher volatility (price swings), which many investors underestimate.
Focusing on short-term performance. One year of strong or weak returns doesn’t define long-term success.
Expecting consistent returns. Markets fluctuate, and returns vary year to year.
Overestimating expected stock market returns. Historical averages don’t guarantee future performance.
Another key mistake is skipping portfolio benchmarking entirely. Without comparing your results to a relevant standard, you can’t tell if you’re doing well.
A practical example
Let’s say two investors each earn 6% in a year.
Investor A:
Portfolio: 80% stocks, 20% bonds
Benchmark: global stock index (~8–10% expected long-term)
Investor B:
Portfolio: 30% stocks, 70% bonds
Benchmark: mixed portfolio (~4–6% expected)
Same return—6%. But very different outcomes.
Investor A likely underperformed their benchmark. Investor B likely met or exceeded expectations.
Now add risk into the picture.
Investor A experienced larger ups and downs throughout the year, while Investor B had a smoother ride. This highlights the trade-off between risk and return.
A good portfolio return is not just about the number—it’s about whether that number makes sense for the risk taken.
How to apply this to your own portfolio
To determine whether you have a good portfolio return, you need a structured approach.
Start with these steps:
Define your asset allocation (how much you have in stocks, bonds, etc.).
Choose a relevant benchmark that matches your allocation.
Track your returns over time, not just at one point.
Compare your performance consistently using portfolio benchmarking.
Adjust expectations based on your risk level.
This is where many investors struggle. Calculating returns is one thing—comparing them correctly is another.
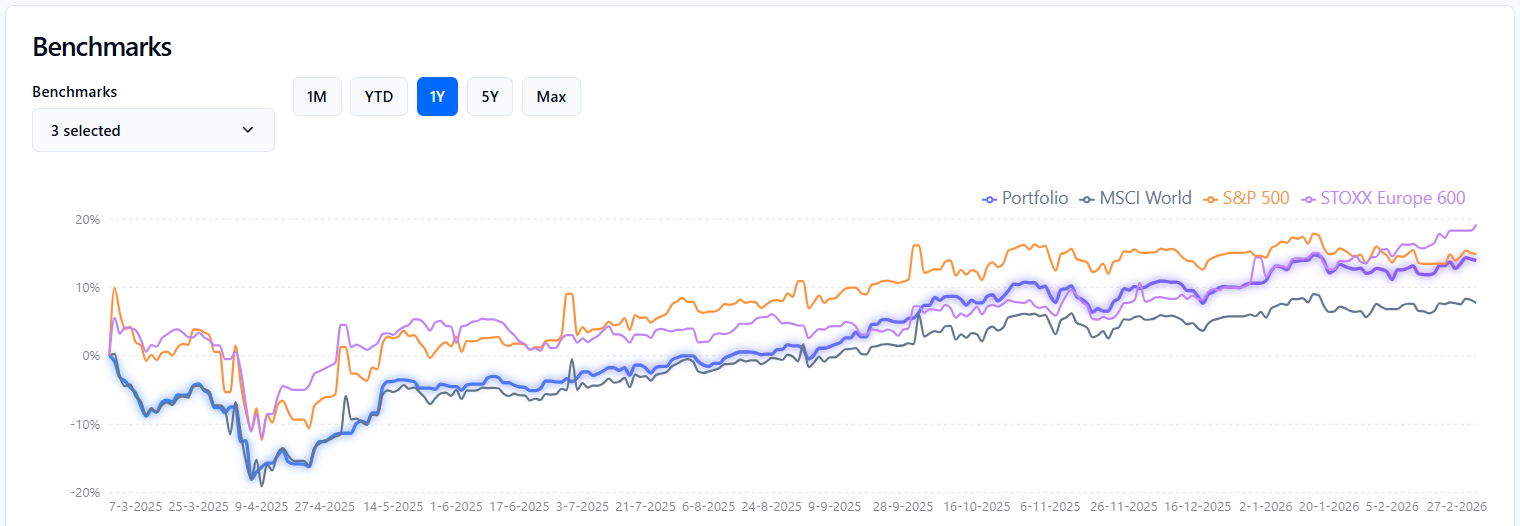
A tool like TrackinV shows you this clearly. In TrackinV’s dashboard you can see your portfolio return alongside a benchmark portfolio performance, helping you understand whether you’re ahead or behind.
Instead of guessing, you get a data-driven answer.
The bottom line
A good portfolio return is not about chasing the highest number—it’s about achieving returns that match your risk and outperform your benchmark over time. Once you understand average investment return ranges and apply proper portfolio benchmarking, your results become much clearer.
Ready to see your actual portfolio performance?
Track it free at trackinv.com.